#!/usr/bin/perl -w
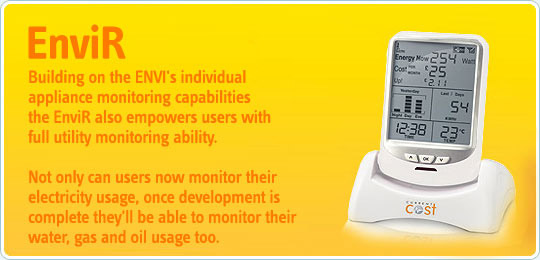
# Reads data from a Current Cost device via serial port.
# extracts the data in each string received and saves to a text file
# /var/www/current_cost/all-string-out.pl
use strict;
use Device::SerialPort qw( :PARAM :STAT 0.07 );
# always ttyUSB0 on first boot - but perhaps not if serial link plugged in later
my $PORT = "/dev/ttyUSB0";
my $ob = Device::SerialPort->new($PORT);
$ob->baudrate (57600);
$ob->write_settings;
open(SERIAL, "+>$PORT");
while (my $line = <SERIAL>) {
___print "$line";
___
___my $channel = substr($line, 89, 1);
___my $power = substr($line, 139, 5);
___my $temperature = substr($line, 70, 4);
___
___my $linelength = length $line;
___
___print "$linelength\n";
___print "$channel\n";
___print "$power\n";
___print "$temperature\n\n";
___
___# 3 files on the ramdisk will hold the most recent versions of the readings
___
___if ($linelength == 166) {
______
_________# save the data to the ramdisk so Blassic can work on it
_________# only work on the 6 second repeating strings that are 166 characters long - ignore history etc
_________# save channel 0 data
_________if ($channel == 0) {
_________open(MYOUTFILE, ">/var/www/ramdisk/CC_power_channel_0.txt"); #open for write, overwrite
_________print MYOUTFILE $power; # string
_________print MYOUTFILE "\n"; #write newline
_________#*** Close the file ***
_________close(MYOUTFILE);
_________}
_________# save channel 2 data
_________if ($channel == 2) {
_________open(MYOUTFILE, ">/var/www/ramdisk/CC_power_channel_2.txt"); #open for write, overwrite
_________print MYOUTFILE $power; # string
_________print MYOUTFILE "\n"; #write newline
_________#*** Close the file ***
_________close(MYOUTFILE);
_________}
_________# save data receiver temperature (comes in both channel 0 and 2 strings)
_________open(MYOUTFILE, ">/var/www/ramdisk/CC_temperature.txt"); #open for write, overwrite
_________print MYOUTFILE $temperature; # string
_________print MYOUTFILE "\n"; #write newline
_________#*** Close the file ***
_________close(MYOUTFILE);
_________}
} |
